
Targeted training has become essential for progress on the bike. Power meters have revolutionized cycling training by allowing athletes to measure actual performance directly at the pedals, crank, or rear hub. These objective watt values are invaluable – for training planning, performance diagnostics… and for the athletes themselves. It’s time to unlock their full potential.
Article published in TrimaX Magazine Issue No. 164
By J.B. Wiroth, PhD in Sports Science
![]()
This article is provided by TrimaX Magazine – one of the leading triathlon magazines. Every month, you’ll find free articles, profiles, and tips on competitions, equipment, and much more related to triathlon, cycling, running, duathlon, and swimrun. Click here to learn more.
What is Power in Cycling?
In physics, power refers to the amount of energy exerted or consumed per unit of time. In other words, it measures how quickly a system generates or uses energy.
In cycling, power is measured in watts (W), named after the Scottish engineer James Watt. Power is always the product of force (or effort) and speed.
For example:
-
Force × linear speed
-
Torque × angular speed
How is Power Measured on a Bike?
In cycling, mechanical power – simply put – is the product of the torque applied to the pedals and the cadence. The harder you pedal and the faster you pedal, the more power you generate.
Torque (Nm) = applied force × crank length
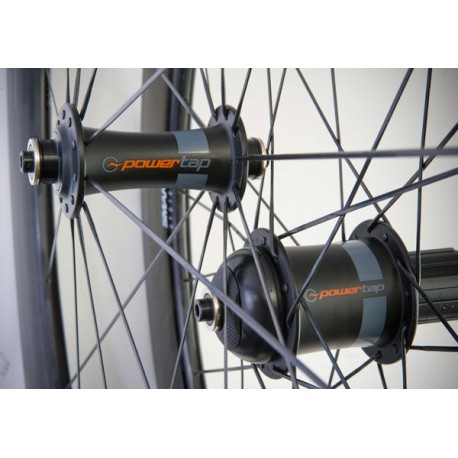
To capture this value, power meters measure both the force applied (e.g., at the pedals, crank, or rear hub) and the rotational speed of the crank arms.
What Affects Your Power?
The power you can generate on the bike depends on several factors:
- Body composition (weight, size, muscle mass)
- Training status
- Physiological capacities (VO2max, anaerobic threshold, etc.)
- Pedaling technique
Absolute vs. Relative Power
To compare athletes, power is often related to body weight. This is known as relative power, measured in watts per kilogram (W/kg).
For example:
- Triathlete A: 1.80m – 80kg – 320W at the threshold
- Triathlete B: 1.65m – 60kg – 240W at the threshold
Both have a relative power of 4W/kg.
- Uphill, they have comparable conditions.
- On flat terrain, Triathlete A has the advantage, as their absolute power (320W) is higher – and at high speeds, air resistance plays a bigger role than body weight.
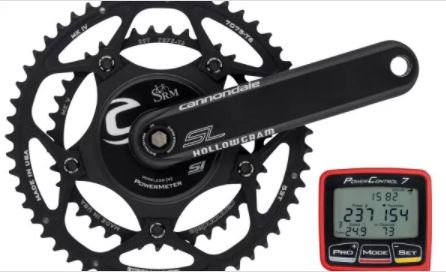
Power Meters: A Built-in Laboratory
In 1987, German engineer Ulrich Schoberer developed the first commercial power meter: the SRM. This was a true revolution in cycling. Since then, many other systems have come to market, including Polar, Powertap, iBike, Quarq, and others.
With these devices, large amounts of data can now be precisely recorded and analyzed during exercise. A modern power meter can display up to six key parameters:
- Power (W)
- Cadence (RPM)
- Torque
- Speed
- Heart rate
- Altitude
Power-Based Benchmarks for Climbs
For longer climbs, relative power (W/kg) can give a rough estimate of performance:
- 4 to 4.5 W/kg: The field stays mostly together.
- 5 to 5.5 W/kg: First selection – the field starts to split.
- 5.5 to 5.7 W/kg: Only the strongest riders can keep the pace.
- 5.7 to 6 W/kg: The best riders break away and lead the pack.
These values are frequently used to assess the climbing performance of top athletes and show how much the wattage influences the dynamics of a race.
On the Flat: A Different Logic
On flat terrain, weight is no longer the primary factor, but aerodynamic drag becomes crucial. The key metric here is absolute power in watts – or more precisely, power in relation to frontal area (W/m²).
This means: at the same power, the more aerodynamic rider will go faster. That’s why time trialists and triathletes invest so much in their riding position, equipment, and gear.
The Power Profile: Making Development Visible
The power profile shows how much maximum power an athlete can sustain over predefined durations – e.g., 5s, 10s, 30s, up to 1 hour. This allows a good assessment of physical performance development over time.
The table below compares two power profiles – one at the beginning of the season and one at mid-season. The progress is especially evident in efforts between 1 and 2 minutes and between 20 and 30 minutes.
The graphical representation makes this development clearly visible – particularly in terms of maximum aerobic power (PMA) and functional threshold power (FTP).
| Time | 20/03/10 | 20/07/10 | Improvement |
|---|---|---|---|
| 5 sec | 850 W | 882 W | + 3.8% |
| 30 sec | 625 W | 638 W | + 2.1% |
| 1 min | 345 W | 375 W | + 8.7% |
| 2 min | 324 W | 355 W | + 9.6% |
| 3 min | 308 W | 325 W | + 5.5% |
| 4 min | 296 W | 300 W | + 1.4% |
| 5 min | 288 W | 290 W | + 0.7% |
| 10 min | 280 W | 295 W | + 5.4% |
| 20 min | 273 W | 305 W | + 11.7% |
| 30 min | 267 W | 296 W | + 10.9% |
| 1 hour | 222 W | 233 W | + 5.0% |
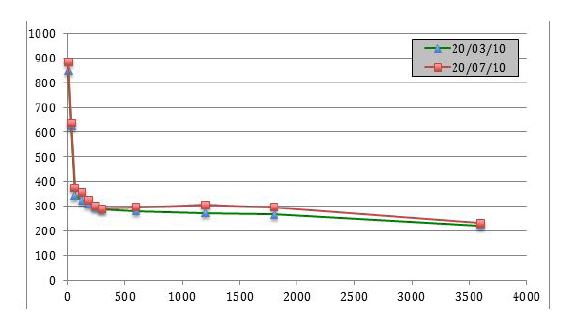
The goal of this triathlete is to strategically shift their power profile upwards – with training that is tailored to the demands of their planned races.
Another advantage of the power profile is that it shows where one stands in comparison to reference values.
For example:
To win a triathlon, one must be able to sustain around 6 W/kg for 3 minutes – this corresponds to 420 watts for a 70 kg body weight.
For a solid finish in an Ironman, at least 4 W/kg for 3 minutes is required – which equals 280 watts for 70 kg.
How to Create a Power Profile?
To create a meaningful power profile, you need a power meter on your bike. Then, perform maximal efforts over different durations: 5s, 10s, 30s, 1min, 4min, 10min, 30min, and 1 hour.
These efforts should be done either uphill or on flat terrain, depending on the type of races you are preparing for. In general, the measured power on a climb is about 10% higher than on flat terrain.
Important: You should only perform such tests when you are physically prepared. A medical stress test beforehand is strongly recommended.
Recommended Protocol for Creating a Power Profile:
Day 1
- 45 minutes of progressive warm-up
- 3 sprints of 12 seconds each, with 3 minutes of active recovery between sprints
- Then, 2 maximum efforts of 1 minute, with 5 minutes of active recovery in between
- Finish with 10 minutes in “Chrono” mode (full effort for the entire time)
Day 2
- Rest day or 1 hour of active recovery
Day 3
- 45 minutes of progressive warm-up
- 2 efforts of 30 seconds each, with 4 minutes of active recovery between efforts
- Then, 2 maximum efforts of 4 minutes each, with 5 minutes of recovery in between
Day 4
- Rest day or 1 hour of active recovery
Day 5
- 45 minutes of progressive warm-up
- 20 minutes in “Chrono” mode (constant maximal power test)
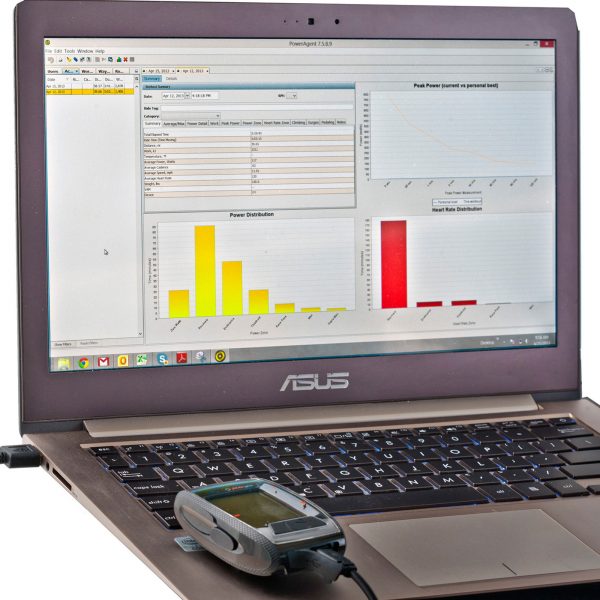
After each session, the collected data should be transferred to a computer and analyzed with software such as PowerAgent, Polar Precision Performance, or CyclingPeaks.
EXPERT ASSESSMENT
“I don’t have a power meter – can I create my power profile using heart rate data?”
“No, unfortunately, this isn’t possible… Heart rate only indirectly reflects muscular effort, especially during short and intense efforts.
For sprints (efforts of 5 to 30 seconds), heart rate does not provide useful information about the intensity.
In contrast, a power meter directly measures the actual muscular effort, regardless of the duration of the effort.
Heart rate is a good control tool for beginners or during the re-entry phase, but it has its limitations for trained athletes.
Nonetheless, it remains valuable even for advanced athletes – for example, to assess cardiac adaptation from training or the metabolic impact of endurance efforts.”