Have you ever wondered how much faster you could be if your bike was a little lighter, if you’d lost a certain amount of weight or if you could improve your threshold power? The 2PEAK Advantage Meter answers these questions and shows you the result for every meter of your chosen route.
What is the advantage meter?
The advantage meter is a 2PEAK tool with the purpose of showing you what time differences changes will make in your cycling.
The differences measured are personal to the data from your ride. It considers your speed, power, weight, estimated aerodynamics for every part of the course you provide. Since these variables affect your speed differently based on where you ride, you can use this tool to see how changing inputs affect your speed on your favorite ride or an upcoming race course.
You can change the following variables in the advantage meter, which are the most important things that determine your speed:
- Rider weight
- Bike
- Wheels
- Helmet
- Clothing
- Number of water bottles
- A hypothetical threshold power increase or decrease
Based on what inputs you have set up, You will get a result and see how much faster or slower you are with different inputs.
How it works
At the moment, you can access the advantage meter only online, and not through the app. In your 2PEAK profile under Statistics click advantage meter or click here.
Step one – upload data file
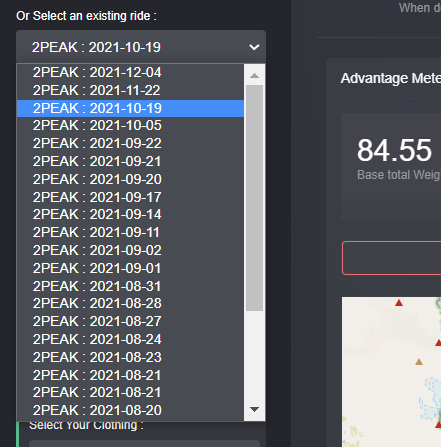
You can analyse any route based on a previous ride. The first step is to select the ride you want to analyse. To do this, you will need to upload a data file with power data. If you already connected your device to 2PEAK you can skip this step. When you don’t have any data files with power it will look like this:
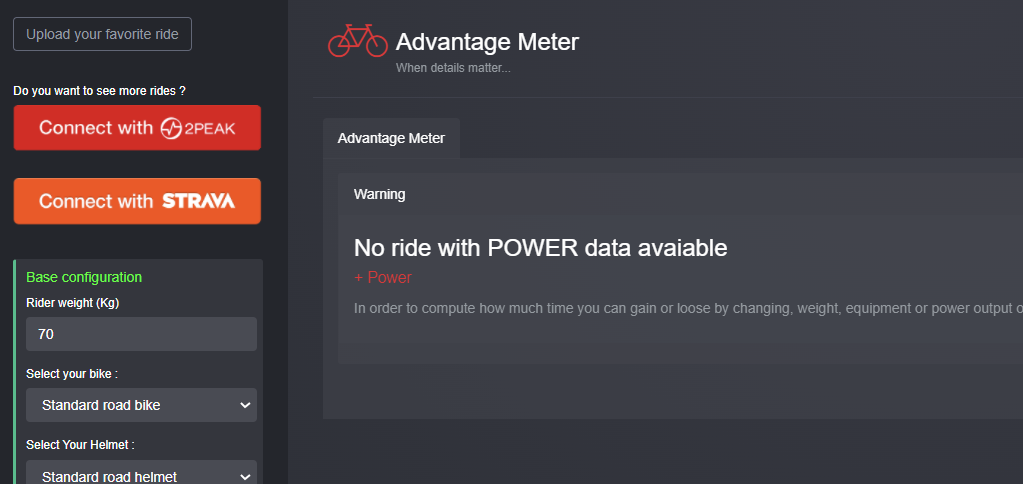
If this is the case, you can upload a file from your training device by clicking upload your favorite ride in the top left corner and manually importing a file in TCX or FIT format. Or you can connect your 2PEAK or Strava account. In any case, it is required that the files you use include power. Estimated power from Strava is not enough. You need actual power data from a power meter.
If you connect your account, you may have multiple files with power, in which case, select the one you want to analyse.
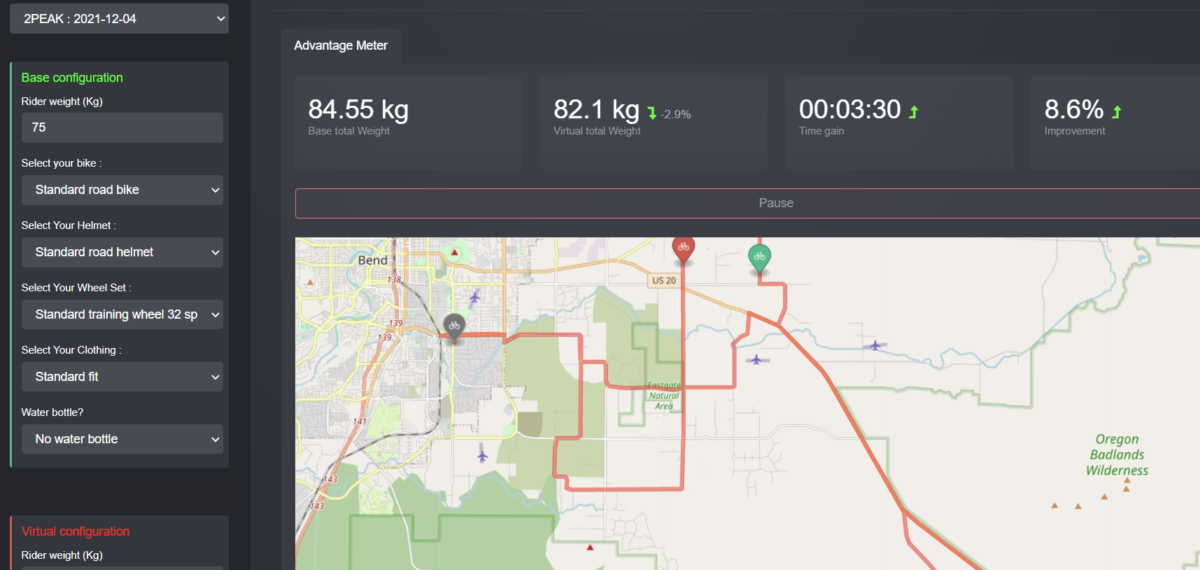
Step 2: fill out base configuration
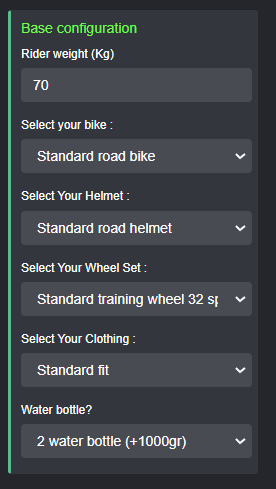 Once you have selected the ride you want to analyse, You have to set up your base configuration. Fill out your weight in kilograms, bike, helmet, wheels, clothing type and amount of water bottles. There are over 80 bikes to choose from, as well as some of the most popular helmets and wheel sets. However, obviously, we can not include all bikes or equipment, so you can use the standard settings to compare against a “normal” configuration or look at the available options and find the base configuration that is the closest match to your configuration.
Step 3: fill out virtual configuration
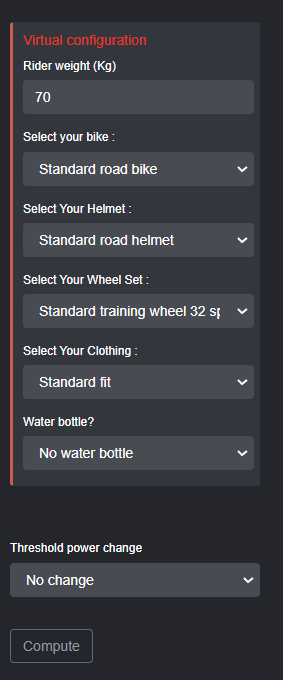
Follow the same process for the virtual configuration as the base configuration. Fill out all the fields, but here you can make adjustments to one or multiple items to see how it impacts your ride. You can test what happens if you lose or gain weight, if you use a different bike, different wheels, different helmet, different kit or you add or ditch a water bottle. Here you can be as creative as you want. You can also add a threshold power change. This means you can see how much faster would I be if I bought a different bike compared to improving fitness or losing weight. At the bottom click compute to see the results once you have made all the adjustments you want.
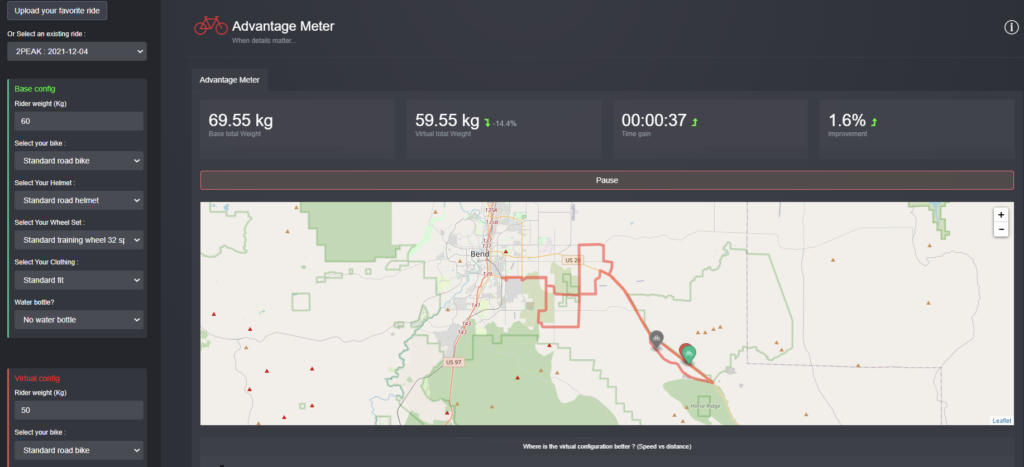
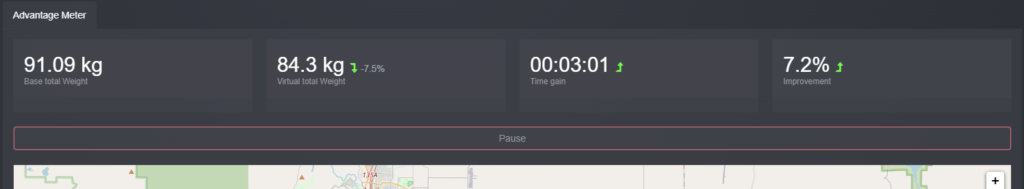
Step 4: See the results
The difference between your base configuration and the virtual rider will be shown at the top of the screen. There will be a mapped animation of the virtual rider racing your base configuration. Under the map there is a graph of when the virtual rider went faster and slower than the base configuration. At the very bottom you will see the profile along with other details about the ride you are analysing.
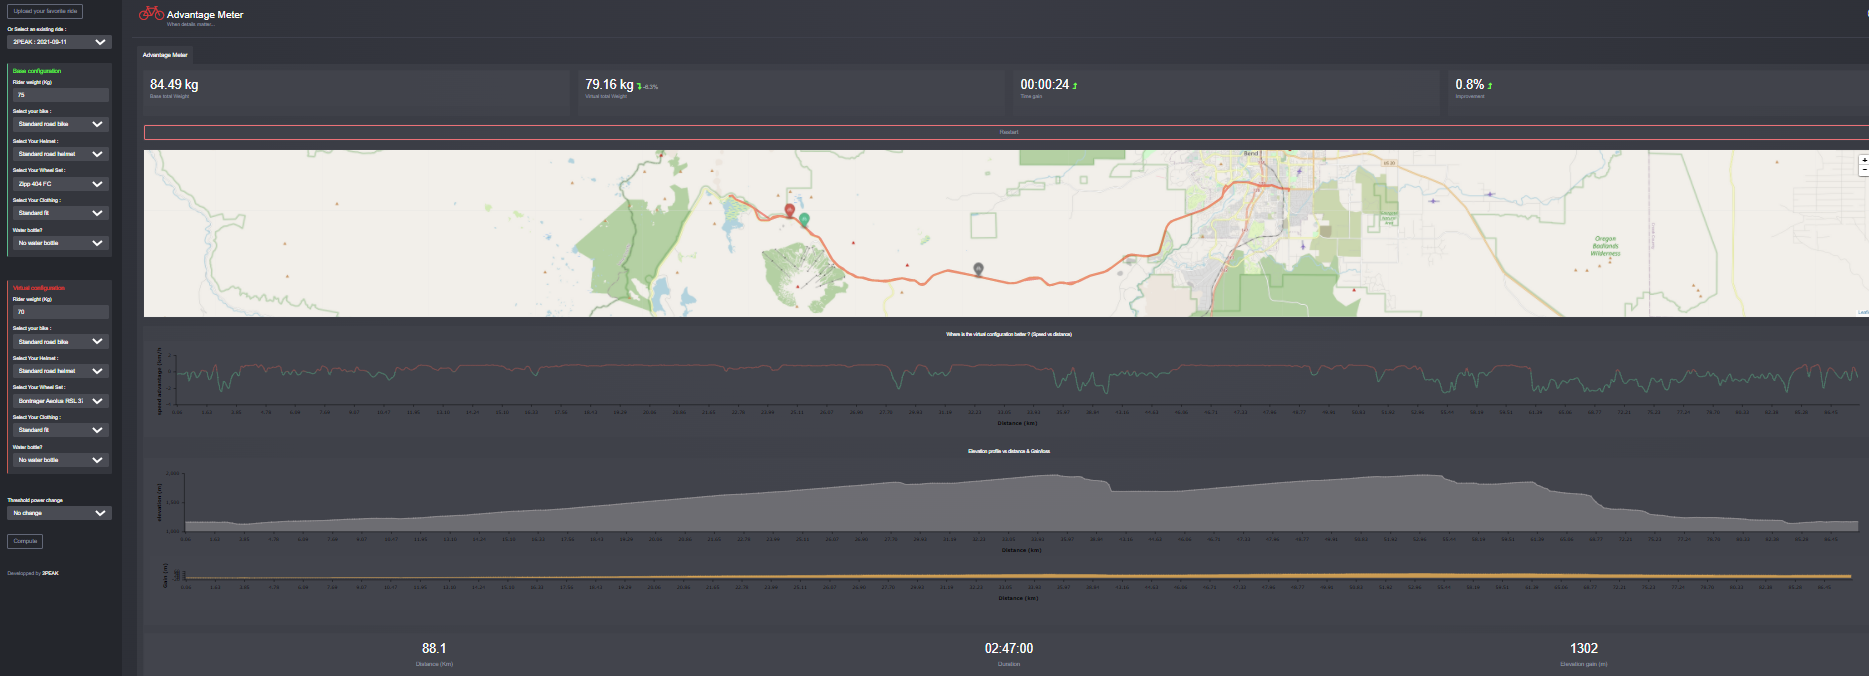
On the example above, you can see the virtual ride improved 24 seconds over the 88km. The virtual rider is lighter but is using heavier, less aerodynamic wheels. Therefore, you can see that the base configuration is sometimes faster. This will change based on the profile of the ride and speed you are going. The example above is up and down a mountain pass. You can see the lighter rider moves much faster on the climb and the more aerodynamic rider makes up some of the lost time on the descent.
The advantage meter tool can not calculate some important external factors such as wind speed and direction, as well as individual rider fit. However, it can give you as accurately as possible how much you can expect to improve by changing some factors. It can help you see if you should change or buy new equipment or focus on improving threshold power or losing weight.
Create with 2PEAK an AI-based training plan for triathlon, cycling and running that adapts to your performance after each workout. Click here to download the app.


Ready to revolutionize your training? Try 2PEAK free for 14 days!
![]()