

The new 2PEAK Performance Index tells you how fit you are right now — FTP on the bike, threshold speed on the run — with no performance test needed. It’s your fitness level, updated continuously — for a plan that adapts even better to your current condition.
To build training that actually makes sense, you need a starting point: knowing how fit you are right now. The trouble is that finding out usually costs you something. A lab test with lactate sampling has a price tag and needs booking; the classic all-out 20-minute test to estimate your power is free but brutal, and nobody wants to repeat it every couple of weeks. And there’s a second problem: any test is a snapshot of a single day. Your form, on the other hand, keeps changing — it climbs with a good block of work, and it drops after a break or an illness. A snapshot taken in March tells you little about where you stand in August.
The Performance Index was built to solve both. It’s the new 2PEAK tool that estimates your current fitness level — and how it changes over time — from your own training, without asking you to take a single test. Let’s look at what it shows and how it works.
What it is, in plain terms
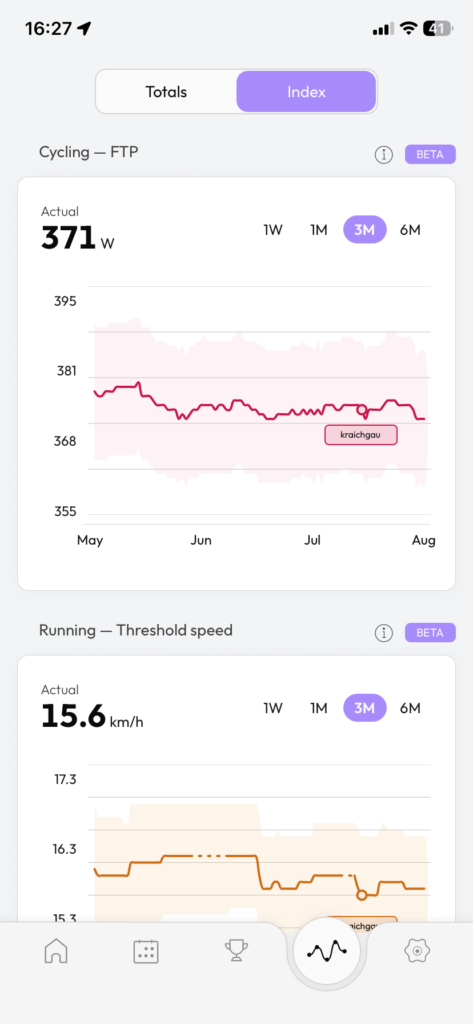
The Performance Index gives you two numbers, one per discipline. For cycling it’s your FTP; for running it’s your threshold speed. Below the value for the day you’ll find a curve that tells the story of the past weeks or months, so you can see at a glance whether you’re improving, holding steady or losing ground. It’s basically a thermometer for your condition that updates itself.
“Development drew on a corpus of approximately one million recorded activities per discipline, contributed by several thousand athletes across the full performance range. A corpus of that size is what makes a test-free estimate viable: it provides sufficient coverage of efforts, durations and recording conditions to characterize the relationship between a workout’s physiological signature and the underlying threshold, and to quantify the margin of error around it.”

Siarhei Thor, AI/ML Engineer at Quevita, who built the models behind the Performance Index
FTP and threshold speed: what we’re talking about
A quick word on the terms, because everything else rests on them. FTP (Functional Threshold Power) is the highest power, in watts, that you can hold for a prolonged effort without blowing up — historically it’s linked to roughly what you could sustain for about an hour. Threshold speed, the running equivalent, is the pace you can keep at that same intensity, expressed in km/h.

Both are practical ways to estimate your anaerobic threshold: the intensity beyond which lactate (a molecule your body produces when it works hard) starts building up in the blood faster than you can clear it. This isn’t just a lab detail: that threshold is one of the best indicators of endurance performance, and for decades it’s been the reference point on which training zones are built (Faude, Kindermann & Meyer, 2009, Sports Medicine). Put simply, if you know your threshold you know what pace to train at — and it’s exactly what 2PEAK uses to calibrate your sessions.
How 2PEAK works it out without a test
Here’s what’s new. Instead of sending you to a lab or making you suffer through a 20-minute test, the Performance Index reads what you already do. Every workout you record — with power, pace and heart rate — is a little road test: it holds information about how hard you can push and for how long. From each session the model draws an estimate of your level, then combines them into a single curve, giving more weight to recent outings, the ones that best describe your form today.
The idea of inferring an athlete’s ability from their performance data is neither new nor improvised: it’s the same principle behind the concept of “critical power”, widely studied in exercise physiology, which holds that the relationship between the intensity and duration of your efforts can point to a reliable performance threshold (Jones & Vanhatalo, 2017, Sports Medicine). The Performance Index applies this logic continuously: the more you train, the more data it has, and the better it describes you.
The band and the confidence score
An honest estimate is never a bare number: it’s a number with a margin. That’s why you see a shaded band around the curve — the range within which your true value can reasonably be expected to fall. When the band is narrow, the estimate is solid; when it’s wide, it means recent data isn’t enough to pin down a precise number.

Telling you the same thing more directly, there’s a confidence score from 0 to 100: the higher it is, the tighter the estimate and the more you can rely on it; the lower it is, the more the model needs steady data to sharpen up. It’s a way of stopping you from taking at face value a number that, at that moment, is still a provisional guess.
“Accuracy is conditional on what the recording contains. The estimate is at its tightest when the data streams are complete: pace, heart rate, elevation, and power where available; and when the training window covers at least three distinct session types, so the model observes the athlete across a range of intensities and durations rather than one repeated stimulus. Under those conditions, validated against a competition effort recorded close to the same period, the mean error narrows to approximately 0.7 km/h for running threshold speed and around 14 watts for cycling FTP. Sparse or single-modality histories widen that interval, which is precisely what the confidence band is there to show.”
Siarhei Thor, AI/ML Engineer at Quevita, who built the models behind the Performance Index
When to take it with a pinch of salt
Precisely because it lives on your data, the Performance Index is at its best when you feed it consistently, and two situations tell you to go easy. The first is a lack of recent data: if more than a week has passed since your last useful outing, the latest value is now stale and should be treated with caution — just record a workout to refresh it. The second is the calibration phase: until you’ve logged at least seven valid sessions, the model is still finding its aim, and the estimate can shift quite a bit as you add workouts.
Why it really helps you
The practical payoff is twofold. First, you no longer pay — in money, time or effort — to know where you stand: no fitness test, no expensive diagnostics. Second, your plan benefits directly. 2PEAK adapts your workouts to your level; if that level is updated continuously, rather than stuck at the last time you took a test, the planning gets more accurate. Watching the curve also helps you read your season: you can tell whether a block of work is paying off, how much a break cost you, whether you’re recovering the way you hoped. And it works on the same logic whether you’re on the pedals or in running shoes.
Where to find it
You’ll find the Performance Index right inside 2PEAK. In the app, tap the wave-shaped icon in the bottom bar and switch to the “Index” tab: the cycling and running graphs sit one below the other. On the web, open it under Statistics > Performance Index.
In short
The point, in the end, is simple: knowing how fit you are shouldn’t take a painful test every time, nor a number that ages in a drawer. The Performance Index gives you a continuous, honest read on your form — margin of error included — and puts it straight to work in your plan. Keep an eye on it for a few weeks, feed it with regularly recorded workouts, and it’ll become one of the most useful tools for understanding where you are and where you’re headed.
Sources
Faude O., Kindermann W., Meyer T. (2009). Lactate Threshold Concepts – How Valid Are They? Sports Medicine, 39(6), 469–490. — The lactate (or anaerobic) threshold is among the best indicators of endurance performance and the reference point for setting training intensities and zones.
Jones A. M., Vanhatalo A. (2017). The ‘Critical Power’ Concept: Applications to Sports Performance with a Focus on Intermittent High-Intensity Exercise. Sports Medicine, 47(Suppl 1), 65–78. — The relationship between the intensity and duration of efforts makes it possible to estimate a physiologically meaningful performance threshold from training data.