Here we will show you saved data streams of interesting stages. The biometric data has been acquired with an SRM powermeter integrated into a Cannondale Hollowgram crank ridden during stages of the ’05 and ’04 Tour de France.
HEW Cyclassics 2005 – late shake-out
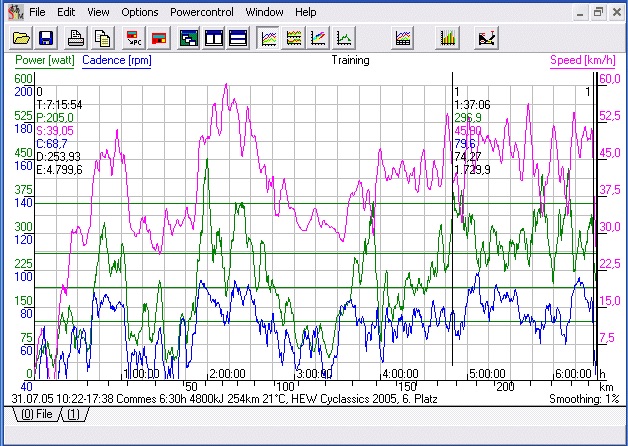
Long races require a long lasting breath. Those who want to be successful need patience to hold back until it really counts. The graph of Salvatore Commesso’s (Lampre Caffitta) tachometer, shows the virtue well. Commesso started real easy. In the first hot phase – 20 minutes tempo after the first half hour into the race – Commesso was hiding in the peloton and limited his power output (green line). When Jörg Ludewig pedaled away, everyone relaxed and the speed settled cyclotourist pace. It took almost two hours, Ludewig already gained 20 minutes, there was a speed surge, because a 28 man group got away and the peloton reacted.
It was Team Gerolsteiner who took the responsibility of reeling them in. It took them a little more then 30 minutes with a speed peak of 60 Km/h (see the peak on the pink graph). As soon as they got caught again the pace settled to comfort level. The real race started at the 180k mark, which is highlighted by the vertical black lines marking an interval. During the last 70k Commesso produced an average of 300 Watt (his average for the race: 200 Watt), which consist of many peaks in between 400 and 900 Watt. Ludewig and Leif Hoste got pulled back real fast in the last phase of the race.
The last ride over the Waseberg made the decisive selection (as expected) and Commesso was alert and part of the right group. In the sprint of 15 remaining riders, he finished sixth, Ullrich last. Filippo Pozzato won in front of his teammate from Quick Step Luca Paolini. Both were holding back in the last kilometers while Fassa Bortolo, with 4(!) riders seemed a little lost keeping the tempo up, but they saved what resulted to be the decisive energy.
Commesso’s teammate Enrico Franzoi, who missed the last group ride, averaged a higher energy expenditure than his more experienced colleague. An indication for the smart allocation of resources from Commesso and a further proof that bike races are not won by the highest energy expenditure but by smart tactics.
Partial decision at Waseberg
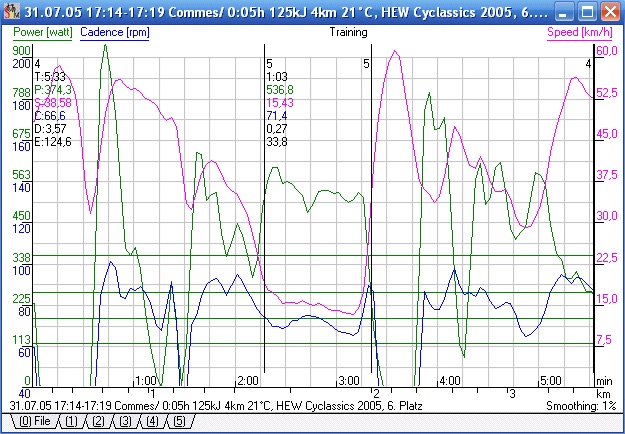
This extract of the data above shows the last transition at the Waseberg climb. The selection starts with the end of the descent that gets to the foot of the Waseberg. The 900 Watt Peak before minute one is the acceleration before the second before last turn which Commesso used to get himself into position. After the last turn into the climb the power output is surging again impressively.
The heart of the climb can be seen by the speed dropping to 15 km/h again marked by the two black lines. Salvatore is producing 537 Watts for the one minute of the climb. In the second, shorter climb followed by a short descent (speed peak after the marked section) the riders that make the leading group shakes out. It is here where the sprinters, such as Erik Zabel and O’Grady looses contact. Possibly the sprinters focused too much energy on surviving the first part of the climb. Allen Davies is the only one that manages to spend his energy equally and finishes the race third. Commesso stays concentrated in the second part of the climb investing 800 W, which keeps in contact with the lead group with Ullrich and Rebellin.
Stage 8. Tour de France 2005 – A hard day at work trying to stay ahead
Redline start: After just 17 Kilometers, the first serious climb began and Salvatore Commesso wanted to be part of the challengers. Initially, numerous solo attempts to escape were made, until a group of 7 riders was able to get away, managing to stay ahead until the last climb of the day when the GC leaders reeled them back.
With an average power output of an amazing 416 Watts, Commesso stormed ahead on the first climb (Dobel) in just 12 minutes – from zero to full power in no time. Also, the next few climbs required quite an effort. The data demonstrates how the topography dictates the effort. Peaks in the power output represent the climbs. On the flat stretch after the climbs, Toto Commesso spent an average of 260 Watts over 2 hours, which gave him an average speed of 47 km/h in the 7 man group! This demonstrates how the pros are aerodynamically well positioned on their bikes…
On the last climb the workload of the day started to collect its interest. Commesso was unable to respond to Pieter Weening’s attack and climbed the Col de la Schlucht with an average of 330 Watts. At the end of the day, he had still spent an impressive 5000 kJ. In comparison: teammate Gerrit Glomser, who spent his day in the peloton, consumed “only” 3500 kJ – this translates into 2 big plates of pasta less for the Austrian this evening…
7. Stage Tour de France 2005 – Sprint for 4th in Karlsruhe, Germany
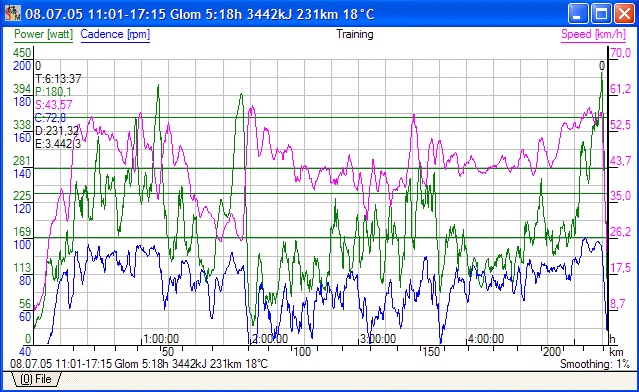
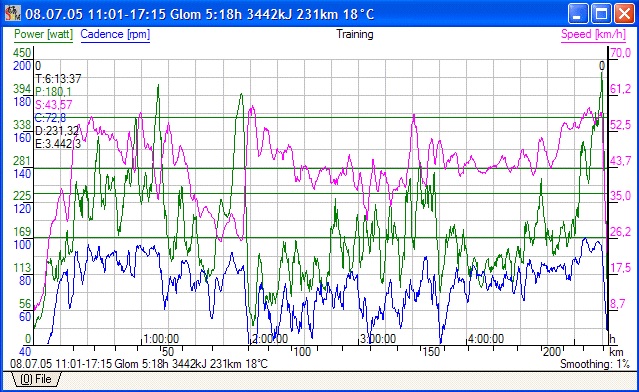
Gerrit Glomser’s graph above, shows a relatively easy day for the most part as he rides in the peloton. With the exception of the nervous first hour of the stage and a power peak climbing the Col du Hantz at km 74, the Austrian Champion never had to really open the gas. The average power output of just 180 W and the low energy spent on this relatively long stretch demonstrate the reasonable demand so far. But the savings in the first hours allowed Gerrit to spend big in the last few kilometers as the green power graph demonstrates.
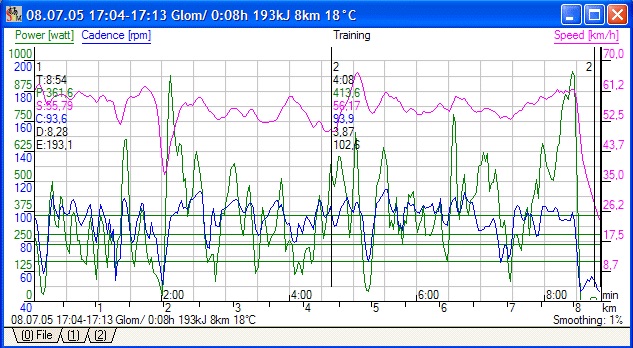
Glomser’s sprint in the tumultuous finish nets him an excellent fourth place: You can see that during the last 9 minutes on the graph, Gerrit has to produce beyond 700W several times to get into a good sprinting position. And of course, the time he spends protected from the wind can also be observed as you see stretches when he rides at 60 km/h but with very little power output. Even his average power output of “only” 360 Watts while riding an average of 56 Km/h can only be explained by the drag advantage. In the last 400 meters, you can see what it costs to be in the wind. Gerrit has to generate an average of 750 Watts to ride tempo at 61 Km/h!
Tour de France 2005 stage 5 – Commesso in the escape group versus Glomser back in the peloton, both team Lampre-Cafitta
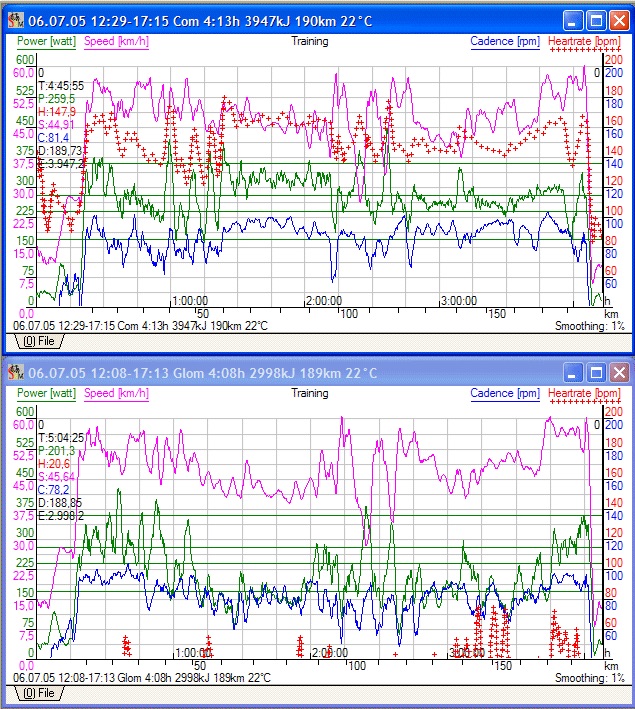
The power data shows us impressively how much more power you need to invest if you want to stay ahead of the field. The upper graphs shows Commesso’s power output while the lower shows Glomser’s, which after responding to several attacks in the first hour of the race could hide comfortably in the peloton. We see a difference of 260 versus 201 Watts of power output. Correspondingly, Commesso had to spend a quarter more energy – approximately 4.000 instead of 3.000 kJ!
Also interesting is the rather high speed (52 km/h) in the first hour as a result of the attacks from the field which are so typical for the early stages in the Tour. After an hour, Commesso digs deep and escapes, which is well reflected in his power peak on the green graph. After he catches first Bodrogi and then Carlstrom, his power output stabilizes as the group works well together. At the same time, you see on Glomser’s curve how the main field slows down. It is in this phase that the Commesso group gains their maximum advantage of 4:11 for the day (at km 85 – this is where they catch Juan Antonio Flecha, who was leading solo until now).
The power peak at km 109 is due to the 4th category climb. At the end of the stage, we now see how Glomser’s power curve surges as the peloton started to chase seriously and finally catches the escape group with 11 k to go. End of the game!
Power data of the first stage from Saeco/Cannondale pro Gerrit Glomser
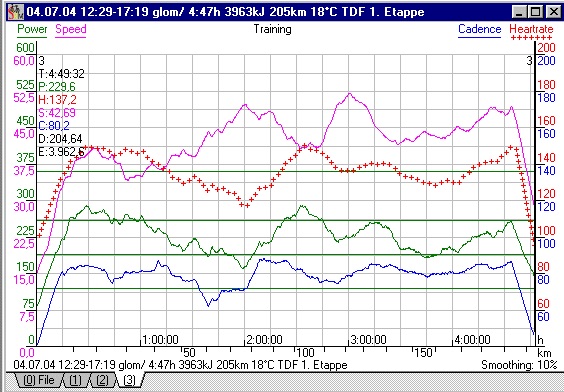
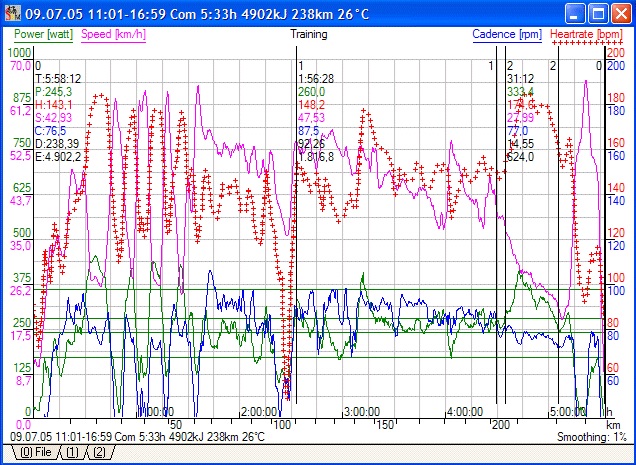
The 4 graphs show over the horizontal time x-axis, speed (purple, left y-axis), heart rate (red, right y-axis), power (green, left y-axis) and cadence (blue, right y-axis). The graphs have been smoothed considerably in order to show the evolution of the average effort rather than the extremes.
The averages for the stage are summarized in the upper left corner of the graph: 229,6 watt average power output, an average heart rate of 137,2 and an average speed of 42,69 km/h describe how Gerrit Glomser managed his effort during a stage spent hidden in the peloton working for team leader Gilberto Simoni.
Analysis of the first stage Tour de France 2004
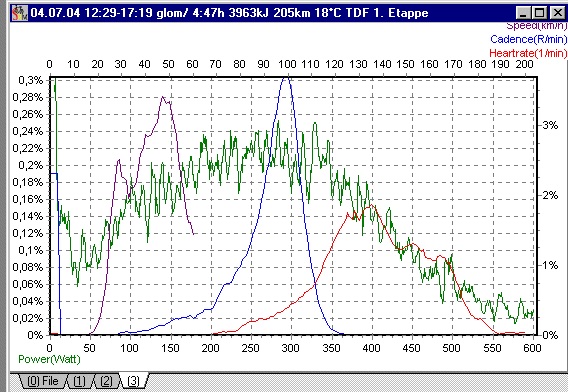
This view of the first stage shows the commonness of the data and reveals the characteristic of the stage. The power output (green, lower axis) is spread relatively equally in between 100 until 400 watts. Above this, Gerrit had also to produce short bursts above 600 watts. This means that Gerrit spent a lot of time in the relative comfort of the draft inside the peloton, but also had to sometimes work hard in the wind working above his threshold of 390 watts.
A look at the speeds shows why such a high power output was needed: the mean speed (purple, upper x-axis) can be determined at the highest swing and is above 50 km/h!! If you are riding in the wind you have to produce 400-500 watts to sustain this speed. The mean peak on the cadence graph shows the fluid cadence that Gerrit prefers: just around 100 rpm’s. Overall it is easy to see how the high average speed can be achieved mainly by sharing the work in the peloton. Since the average power output is relatively low compared to the high average speed.
