Unique insights into the ‘engines’ of pro triathletes. Data recorded during the IronMan cycling section using an SRM powermeter crankset.
Faris Al-Sultan, Ironman World Champion 2005
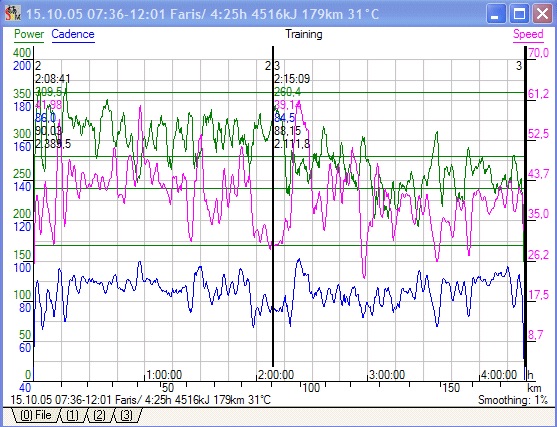
Data from the champion: the graph shows power (green), speed (pink) and cadence (blue) from the bavarian pro Faris Al Sultan. The power output over the cycling section averaged 283 watts, the average speed: 40.45 km/h, the average cadence was 85 rpm.
Faris, who had the third best swim, got himself ahead and led the field after just 14 minutes and produced an average of 324 watts until the first split time. Thus he started much more conservatively than last year when he averaged 343 watts for the same split. His bike race can be divided into two segments as regards power output and these altered at the turnaround point in Hawi.
During the first 90 km his average power kept close to 309 watts, in the second segment however he had a few weak moments but the rest of the field must have had similar problems, as he was still able to defend his advantage. Not until the end of the cycling section was he passed by Torbjörn Sindballe whose data can also be seen below.
Torbjorn Sindballe, sets new bike leg record in Kona
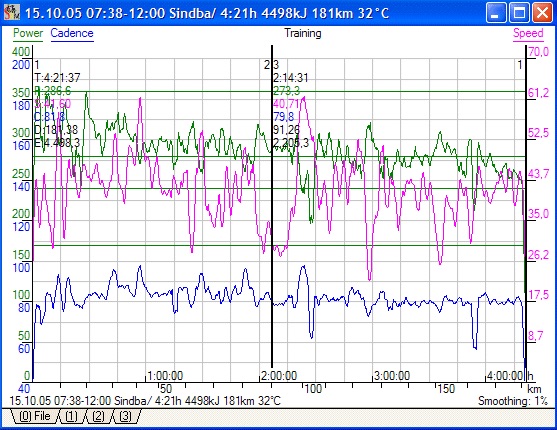
New record: 4:21:57 hours with hot but pretty calm wind conditions.
Torbjorn Sindballe breaks the record of 4:24:50 which Thomas Hellriegel established back in 1996. The graph shows how well Torbjorn paced himself. His average power output of 300 watts in the first half of the cycling section is only slightly above that in the second half when the Danish express produced an average of 273 watts. With his consistent and strong effort, he managed to pass Faris with 10k to go after having spent most of the race just 3:00 behind. It is clear that he has an excellent aerodynamic position. Despite his 10kg weight disadvantage to Faris to haul up Hawi, he needed on average only 3 more Watts than the champion for the same speed. We can assume the difference is the effort to catch and pass Faris. (286 watts).
2004 World Championship data
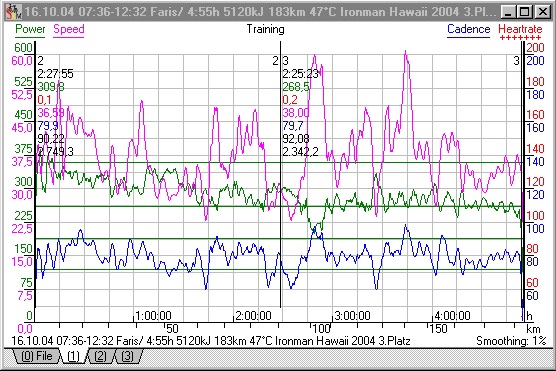
Data from Faris Al Sultan, 3rd place overall

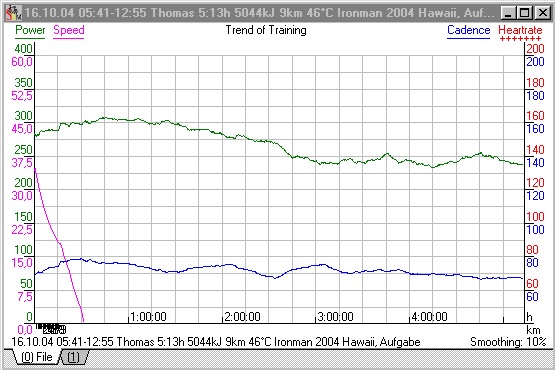
The graph shows the power (green), speed (pink) and rpm (blue) of German Pro Faris Al Sultan. Faris averaged 286,9 W and 37,0 km/h on the windy and difficult course. The interval marks (vertical lines) show average data for the first and second half of the race. Average power dropped from 309 to 268,5 in the second half. Faris started out very fast, hammering way above 300 Watt for the first 1,5 hours. After this brave phase, although at a slightly lower level, he stays pretty constant. Variations in the speed graph are indicative of the climbs and descents. Speed is generally higher in the second half. Look how Faris keeps his power output up in the descents by using a huge gear. Apart from the descents, where he reaches 100 rpm, he is pedalling at a steady 80 rpm.
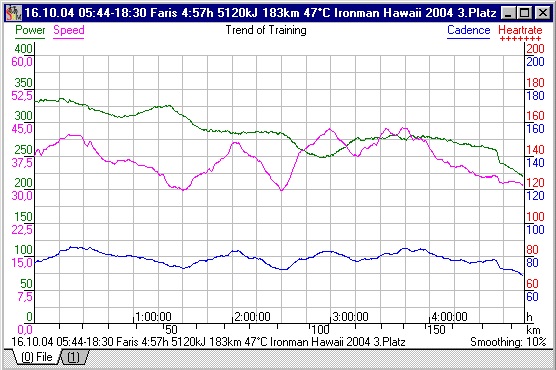
Smoothened signal: The average power output is clearer in this graph. The sharp drop in the last 20 minutes is mainly due to the smoothing.
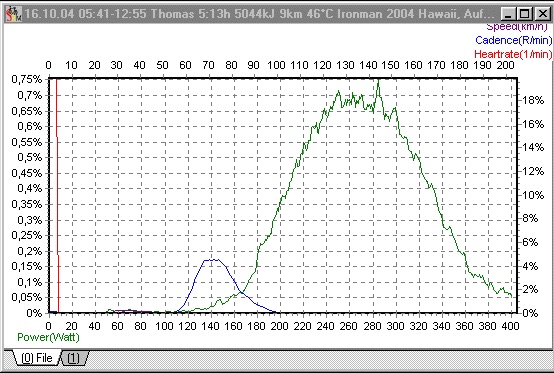
Data Distribution: This graph shows the time spent by Faris at which power/speed/rpm. Most frequent speed (highest peak in the pink curve) is 30 km/h – the total range is between 20 and 60. His power band is wide – from 180 to 400 W. Most frequent power is around 300 W.
Data from Fernanda Keller, 9th place
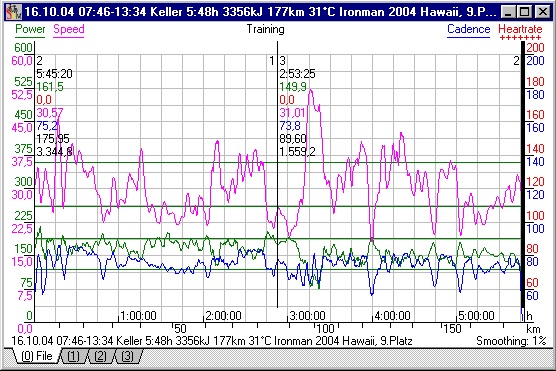
Fernanda’s speed signal is similar to Faris’ but at a lower level due to the lower power. Fernanda averages 161 Watts and 30,6 km/h. Taking her light weight into account she has a power/weight ratio of 3,22 W/kg – approx. 20% less than the top men.
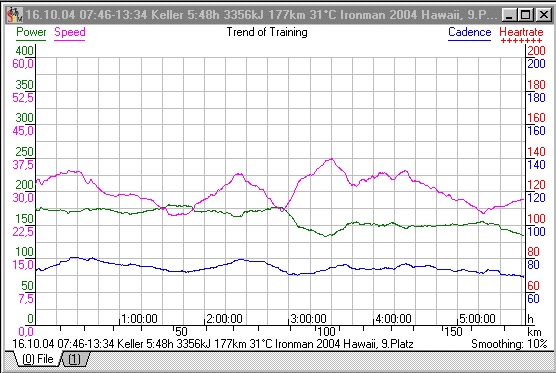
Smoothened graph: look how constantly she pedals! After 3:11 hours something happened: Power dropped off.
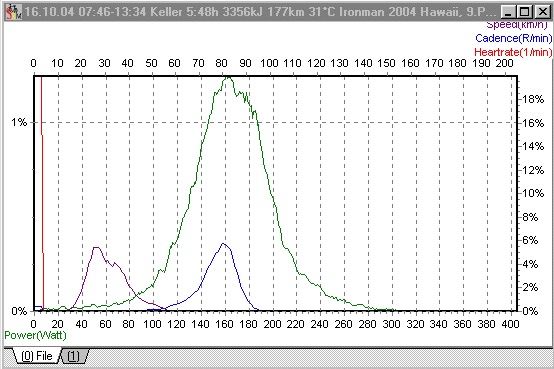
Power distribution: compared to the men the power curve is shifted to the left and it is less wide because of the more controlled and constant riding style.
Data from Thomas Hellriegel (DNF)
Not a good day for the champion: Although Thomas kept himself in check at the start, he couldn’t maintain the desired power level of 300W. In the end he averaged 268 Watt. (no speed signal)
Power distribution
Data from Markus Forster, place 27
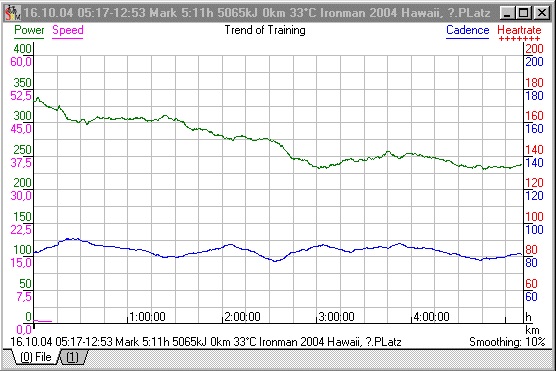
Too fast at the beginning: Markus started with 400W, averaged 312,5 in the first 1,5 hours (first split only 2 minutes down to the winner) but had to pay for his effort later. In the last 2 hours he averaged 243 Watts.
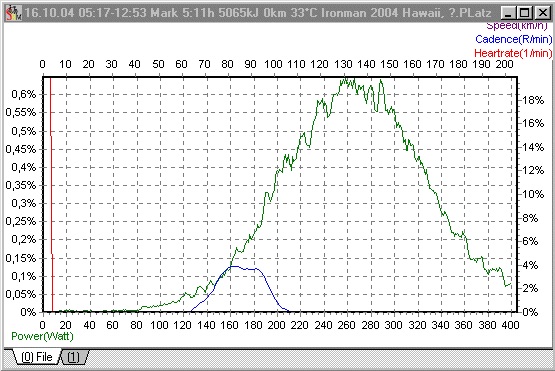
Fluent style: Markus pedals between 80 and 90 RPMS. His Power band is wide – from 140 to 400 W.