The main task of 2PEAK is to optimally adapt your training to your individual needs. But in order to strengthen your personal motivation, we also offer you the possibility to analyse your workouts and to graphically illustrate the training effects. For this reason, we would now like to introduce you to the statistics and analysis page of our app.
The statistics page of the 2PEAK app (iOS / Android) is accessible via the corresponding tab at the bottom of the screen and is split into two areas: “Total” and “Index”.
“Total” – the overview of completed trainings
The statistics overview contains four different graphics that let you analyse the training activities of the past 30, 60 or 90 days more closely.
SPORTS
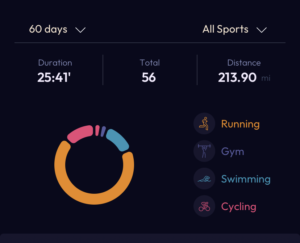
The top graph shows you how much time you spent on training in the different sports during the selected period.
TRAINING ZONES
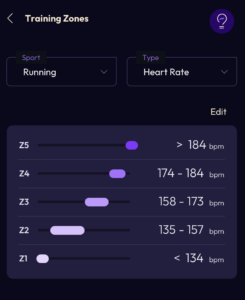
Here you can find out in which intensity zones you exercised. The percentage shown on the left in “white” indicates the relative amount of training time spent in each zone. The column next to it shows how the distribution should have been according to the units performed.
DURATION
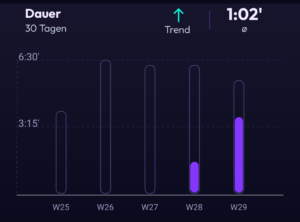
The indicated bars show the planned training volume for the selected period. The colour-filled part reflects the actual training duration.
LOAD
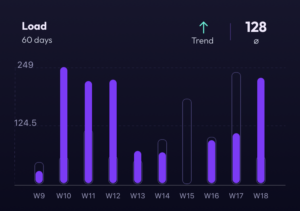
Load is the combined performance of duration and intensity. The load can be enhanced by increasing the training duration or intensity. The indicated bars describe the planned training load, while the colour-filled bars correspond to the performed training load.
“Index” – illustration of development and potential
On the so-called “Index” page you will find the Fitness Index and the Training Meter. The two graphs relate to personal training development and training efficiency.
FITNESS INDEX
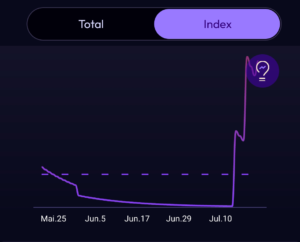
The fitness index shows you the development of your fitness in the desired period of time. While the curve increases after a training session (more or less depending on the type of training), the values decrease during longer training-free periods. The dashed line describes the average fitness level of the last weeks.
TRAINING METER
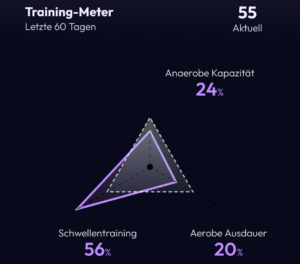
The Training Meter shows how balanced your training is: if you follow the suggested 1:1 training, the areas will be balanced; if you train one area more than the others, the relative weighting will increase.
Deficiencies in any of the three components may occur if either the suggested workouts have not been fully implemented or if, due to circumstances and/or personal attitudes, it has not been possible to plan adequately for the corresponding form of training. It is also possible that one of the three components was trained more strongly, resulting in the relative weakening of the other two.
Note that this analysis should not be seen as an indication of weaknesses, but rather as an aid to progress faster. By identifying deficits and imbalances, targeted measures can be taken to make training more effective and balanced, ultimately leading to better performance.