
2PEAK uses the increasingly popular Critical Power Method to define training zones and assess an athlete’s strengths and weaknesses. But what is critical power? Here we explain this seemingly complex training statistic in a simple way and how it is used in 2PEAK.
What is Critical Power?
The simplest definition of critical power is:
Critical Power – The power that can be maintained in a training session or competition over a certain period of time without fatigue. Or the tolerable duration of a high-intensity workout.
Critical Power, also known as critical speed in running, indicates a maximum sustainable training intensity over an extended period of time. There is also a known amount of effort that can be performed above this intensity before total exhaustion occurs, known commonly as W´.
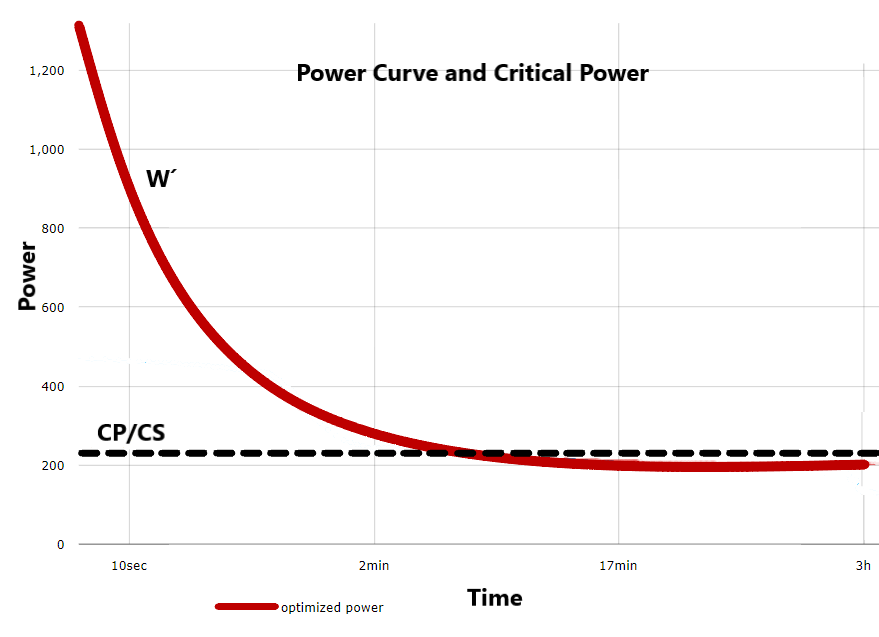
The optimized power is mathematically determined based on how much power an athlete can produce for different time periods. As you would expect, this produces a non-linear hyperbolic relationship. In other words, an athlete can produce a high power output for 10 seconds. However, over two or three minutes, the power they can produce decreases rapidly. At the upper end of the aerobic time frame, it falls much more slowly and finally flattens out at the right end of the graph.
The horizontal asymptote of this curve, or the point where it flattens out is the Critical power. The curve above the critical power line represents how long you can maintain a specific power output above critical power. To see the specifics of how this is calculated mathematically, as well as other biomechanical implications of critical power, you can read this article. Basically, Critical Power is based on a theory and is closely, but not exactly, related to metabolic energy systems.
Energy systems
It is easy to see how the curve changes when the body switches from one energy system to another. These systems are constantly working together. Their individual power limit within each system is important for determining critical power.
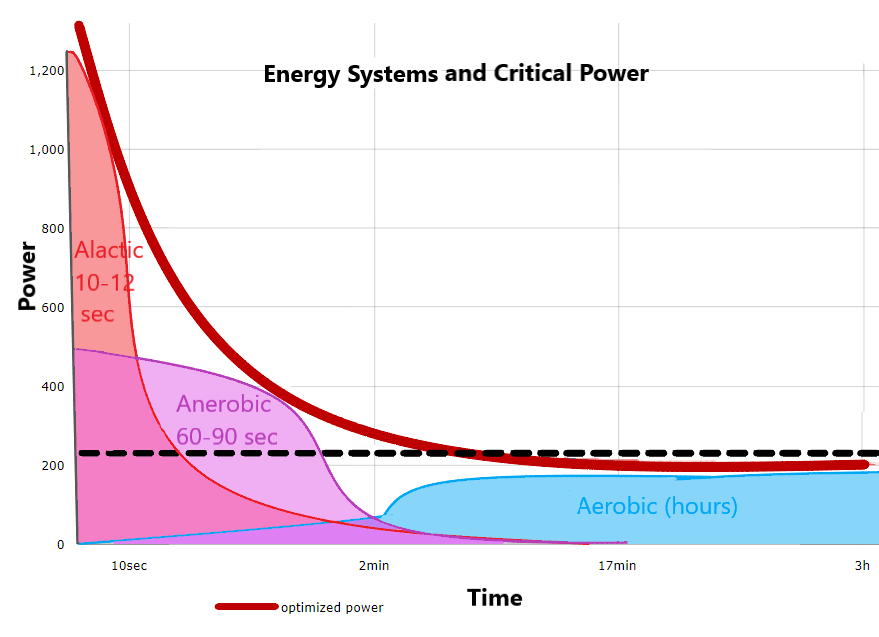
In the aerobic zones, the curve is relatively flat for long periods of time before it begins to rise during high aerobic efforts (between 2 and 15 minutes). Then there is a significant increase in the lactic-anaerobic zone, followed by an even greater increase in the alactic-anaerobic zone (less than 2 minutes).
Aerobic
The long-term system produces energy by burning fats and carbohydrates through aerobic (oxygen-fuelled) pathways. This system is dominant at lower intensities and efforts lasting longer than 2 to 3 minutes. It is slow compared to the other systems, but can be sustained for much longer.
Anaerobic
This system burns glycogen without the use of oxygen. This process is very fast, which makes it particularly useful for short efforts. Cyclists use this system on short climbs or runners on a 400 metre sprint. The work in this system leads to an accumulation of lactate in the muscles. The anaerobic system is completely exhausted within 60 to 120 seconds.
Alactic Anaerobic
This is also known as the creatine phosphate system or sprint system. This form of energy is immediately available because it is stored in the muscles. It allows you to release a lot of power very quickly. Normally, this energy system is depleted within 10-12 seconds and there is then a significant drop in performance. This form of energy is particularly important during sprints.
The interaction of the systems
Energy systems don’t work independently of each other. During exercise, they all work simultaneously to different degrees, depending on how much energy the body needs. Endurance athletes utilise the aerobic system the most, but they also use the immediate and short-term systems during high intensity efforts (intervals, race increases, sprints). A balanced training plan, such as the one created by 2PEAK, utilises all systems. We can use the data from each of these systems to determine the optimal training targets and determine critical power.
Individuality of Power
Like most things in sports, there are significant differences between individuals. Although there is a relation between the power you can deliver in each system, some athletes perform particularly well or poorly in one system or another. Maybe you’re an excellent sprinter, or maybe you’re an aerobic machine. The only way to find out is to look at all the data together and determine the critical power.
Critical Power in 2PEAK
To look at your critical power, go to your 2PEAK statistics and click the critical power chart. If you do not have a 2PEAK account you can create a free 14-day trial. If you connect your Garmin or Strava account, we can retrieve your historical data and create an optimized power curve for you. 2PEAK determines a critical power or BPM for cycling. For running, your graph can be based on speed, BPM or power if you have a running power meter. Using the same concept without a power meter, 2PEAK determines your critical speed or BPM. 2PEAK also has a tool for triathletes and swimmers that calculates critical swim speed. The critical power graph looks something like this, and you can zoom in and view individual sections if needed.
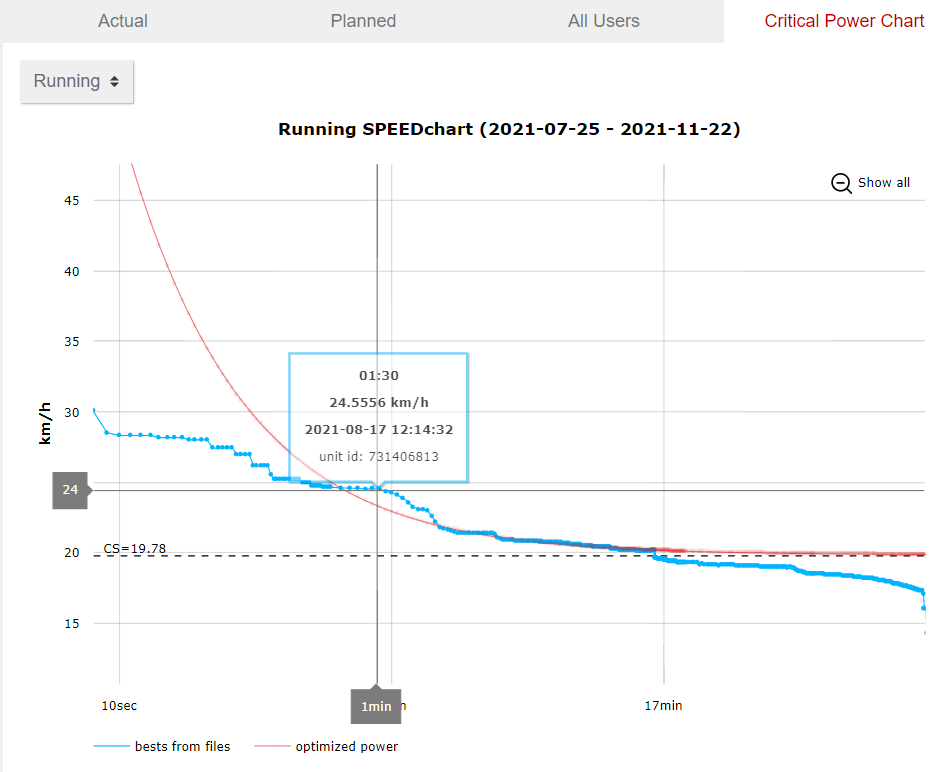
A drop-down menu allows you to specify how much of the current training data should be included in the table. It is also possible to select multiple sports such as running or cycling. This chart is only created for cycling if at least 15 files with power data have been uploaded in the last 90 days.
Critical power in training
Critical power can be used to determine where to focus your training. The data points along the entire power curve show where progress can be made and where to focus in order to achieve the set goals. 2PEAK also automatically determines training zones based on individual results. You can find out more about the automatic training zones for cycling and running here.